ASPM Baselines
Contents |
Overview
There are two sections within the Baselines module:
- ASPM Seasonal Baselines: Allows users to search all advisories in the NTML data warehouse using dates, keywords, and Boolean operators.
- Operations Seasonal Baselines: Displays seasonal averages based on days of the week.
ASPM Baselines data can be viewed on the FAA Operations & Performance Data Web site.
For more information about the ASPM system, see Aviation System Performance Metrics (ASPM).
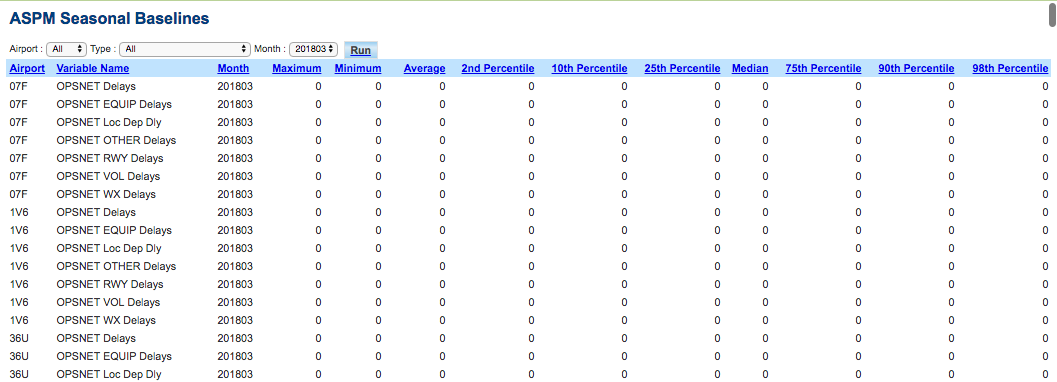
ASPM Seasonal Baselines
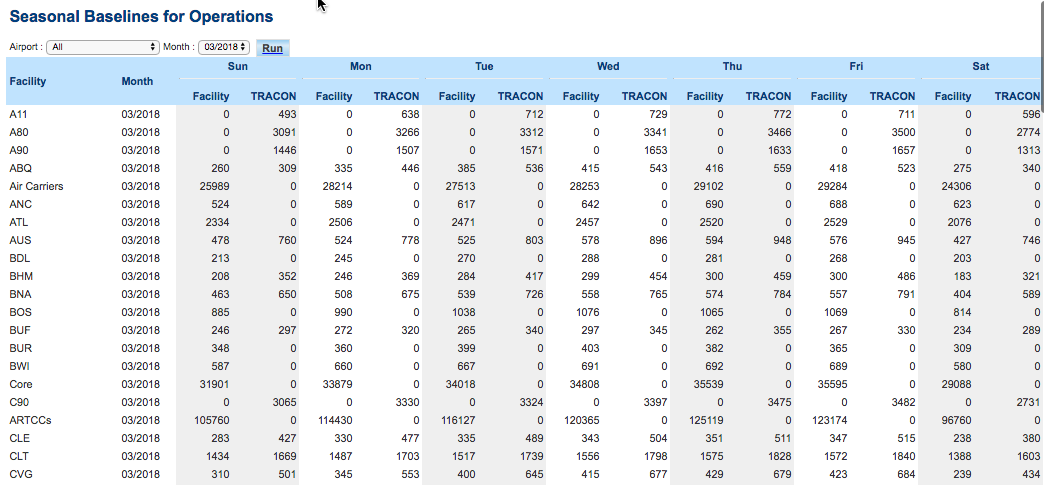
Operation counts are similar, but by day of the week. Sundays are compared to Sundays, Mondays with Mondays and so on. The monthly baseline is the average by day or week for each of the 9 months. Therefore, when calculating a Seasonal Baselines for Operations, the calculation takes the seasonal day of the week average as the baseline.
Seasonal Operations Baseline Example for Sunday 3/15/2020: Average: All Sundays in {February 2019, February 2018, February 2017, March 2019, March 2018, March 2017, April 2019, April 2018, April 2017} By facility and type of operation (Center aircraft handled count, Airport count, TRACON count)
For each variable, ASPM calculates the Maximum, Minimum, Average, 2nd, 10th, 25th,50th, 75th, 90, and 98th percentiles by Airport in the 3-year seasonal time frame.
A dropdown menu includes the selectable variables:
- 100 to 40. Actual Time 100 to 40. The amount of time elapsed between the time the aircraft crossed the 100-mile and the 40-mile circle (in minutes).
- 40 to On. Actual Time 40 to Wheels On. The amount of time elapsed between the time the aircraft crossed the 40-mile circle and wheels on (in minutes).
- Airborne Holding Counts. The number of airborne holds that experience a delay of 5 minutes or more (individual flight entry reported by PDARS through OPSNET).
- Airborne Holding Minutes. The total number of minutes of holding for flights subjected to airborne holding. Source: PDARS through OPSNET
- Arrival Cancellations. The number of canceled arrivals based on Scheduled flights and Active Flight Plans.
- Arrival Completion Rate. The percentage of scheduled and/or planned arrivals that were not canceled.
- Arrival Completion Rate II. The percent of expected flights that arrived. Formula: Metric Flights / (Metric Flights + Cancellations).
- Average Taxi In. The difference between Actual Wheels on time and Actual Gate in time, in minutes.
- Average Taxi Out. The difference between Actual Gate Out time and Actual Wheels Off time, in minutes.
- Departure Cancellations. The number of canceled Departures for scheduled flights. Determined next day using flight plan cancellation messages and scheduled flights not flown. ASQP cancellations are used when available.
- Diversions. The number of flights that were diverted en route from their originally scheduled destination to an alternative airport.
- Excess 100 to 40. Average Excess Minutes 100 To 40 Miles. The average difference between the actual and unimpeded time from 100 to 40 miles from the arrival airport. The unimpeded time is the average time in the previous 12-months, for the 20% of flights with the shortest travel distance, for a given 40-mile crossing point, equipment type, weight class, meteorological conditions, and runway configuration.
- Excess 40 to On. Average Excess Minutes 40 To Wheels On. The average difference between the actual and unimpeded time from 40 miles to wheels on. The unimpeded time is the average time in the previous 12-months for the 20% of flights with the shortest travel distance from 100 to 40, for a given 40-mile crossing point, equipment type, weight class, meteorological conditions, and runway configuration.
- Excess Time Flown.
- Go Arounds. An aborted landing of an aircraft on final approach. The reported numbers do NOT include Military, HELO, “Touch and Go”, unknown, or untagged operations.
- MIT MINMILES (ARR ARPT).
- OPSNET Delays. Delays to Instrument Flight Rules (IFR) traffic of 15 minutes or more, which result from the ATC system detaining an aircraft at the gate, short of the runway, on the runway, on a taxiway, or in a holding configuration anywhere en route.
- OPSNET Equipment Delays. Delays to Instrument Flight Rules (IFR) traffic of 15 minutes or more due to FAA and non-FAA equipment malfunction. For more information, see Types of Delay.
- OPSNET Loc Dep Delays. Delays to Instrument Flight Rules (IFR) traffic of 15 minutes or more due to weather conditions at the departure airport. For more information, see Types of Delay.
- OPSNET Other Delays. Delays to Instrument Flight Rules (IFR) traffic of 15 minutes or more due to "other" factors. For more information, see Types of Delay.
- OPSNET Runway Delays. Delays to Instrument Flight Rules (IFR) traffic of 15 minutes or more due to runway capacity. For more information, see Types of Delay.
- OPSNET Volume Delays. Delays to Instrument Flight Rules (IFR) traffic of 15 minutes or more due to the volume of traffic at an airport. For more information, see Types of Delay.
- OPSNET Weather Delays. Delays to Instrument Flight Rules (IFR) traffic of 15 minutes or more due to weather conditions at airports and en route. For more information, see Types of Delay.
- Weather % Scheduled Operations in M/S.
- MIT Restrictions. The NAS total Miles-in-Trail (MIT) restrictions as "minute/miles". Minute/miles are calculated by multiplying MIT restriction duration (in minutes) by the severity of the restriction (in miles). For example, a restriction lasting 30 minutes, for 20 miles-in-trail = 600 minute/miles. The metric is a total of all MIT minute/miles in the NAS for which data is available for the period. Source: NTML.
The results can be sorted by clicking on any of the field names.
Please note that these values are also calculated for facility ID: NAS (NAS-wide for OPSNET and Diversion values). All ASPM variables are for the ASPM 77 airports, whereas OPSNET Values are for all facilities in the NAS.
Operations Seasonal Baselines
Definitions of Variables
For more information about these topics, please see the specific definitions for Baselines, see ASPM Baselines: Definitions of Variables.

