ASPM: Enroute: Graphs
From ASPMHelp
The Graphs Report of City Pair Enroute displays cumulative graphs, histograms, and box plots summarizing enroute data for the selected flights.
For information about how to create a Graphs Report, see the ASPM City Pair Enroute Manual.
Field definitions are available in ASPM City Pair Enroute: Definitions of Variables.
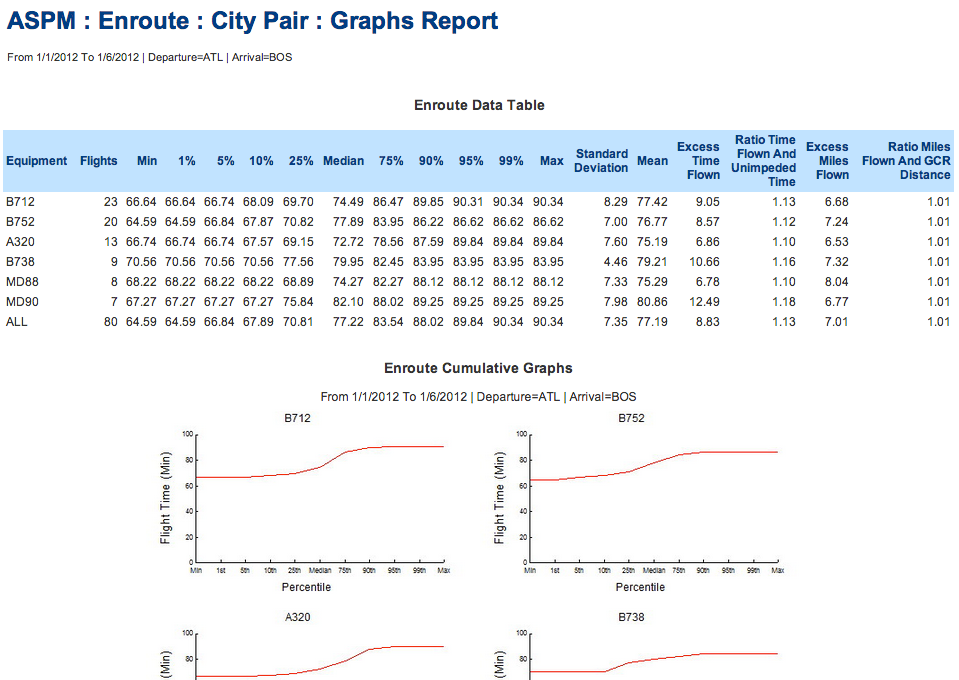
The report displays the following variables:
- Flights
- Min
- 1%
- 5%
- 10%
- 25%
- Median
- 75%
- 90%
- 95%
- %99
- Max
- Standard Deviation
- Mean
- Excess Time Flown
- Ratio Time Flown and Unimpeded Time
- Excess Miles Flown
- Ratio Miles and GCR Distance
For information about other available reports in the City Pair Enroute module, see the Display section.

