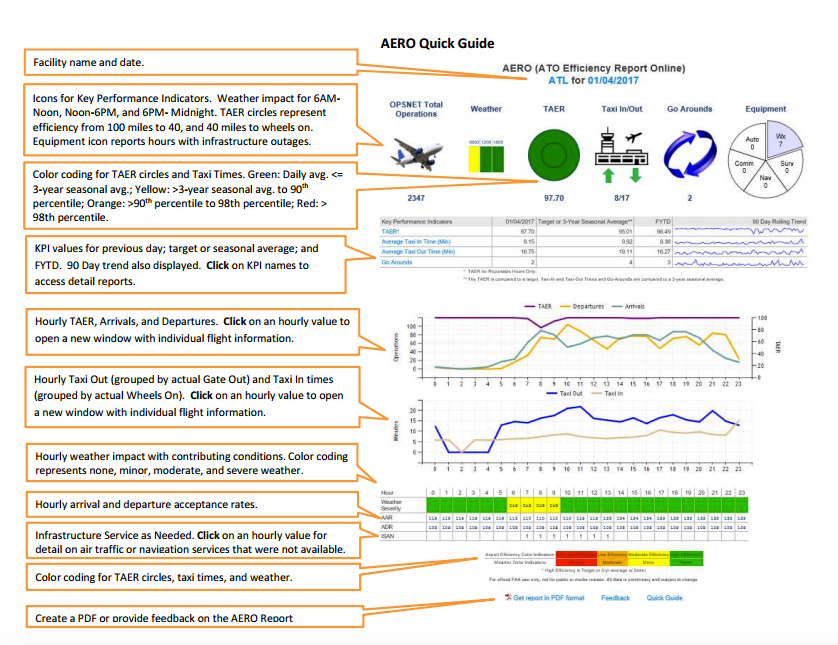
ASPM AERO: Facility AERO Report
The Facility AERO Report can be displayed as a PDF document by clicking on the appropriate link at the bottom of the page.
For information about how to create a Facility AERO Report, see the ASPM AERO Manual and the Quick Guide linked at the bottom of the actual report page.
Field definitions are available in ASPM AERO: Definitions of Variables.
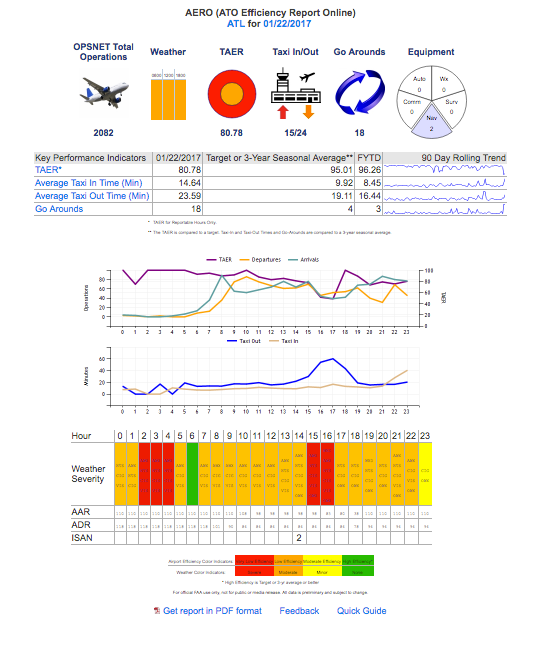
The Facility AERO Report displays the following information:
- OPSNET Total Operations
- Weather
- TAER (Click on KPI names to access detail reports)
- Taxi In/Out
- Go Arounds
- Equipment
- Hourly TAER, Arrivals, and Departures (Click on an hourly value to open a new window with individual flight information.)
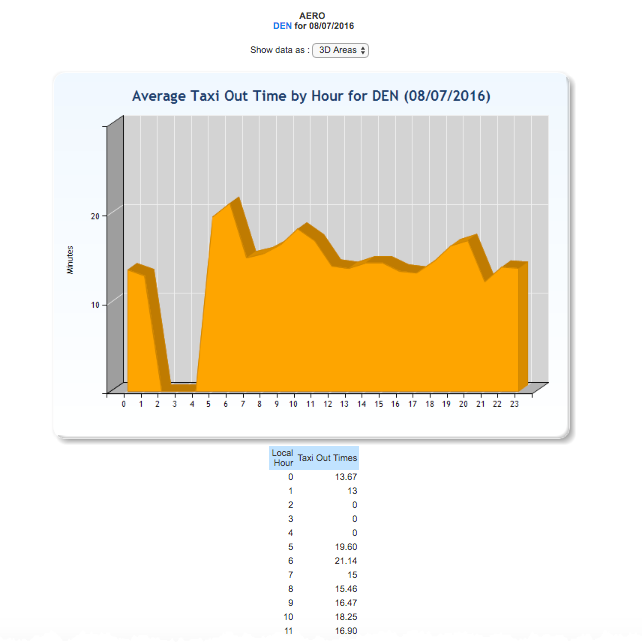
- Hourly Taxi Out (grouped by actual Gate Out) and Taxi In times (grouped by actual Wheels On). (Click on an hourly value to open a new window with individual flight information.)
- Hourly weather severity with contributing conditions. Weather color coding represents none, minor, moderate, and severe
weather conditions.
- Hourly arrival and departure acceptance rates.
- ISAN (Infrastructure Service as Needed).
Color coding for the icons representing TAER 100-to-40 and 40-to-On crossing times, and Taxi Times, represents the following:
- Green: Equal to or better (shorter times)than the 3-year seasonal avg.
- Yellow: From 3-year seasonal avg. to 90th percentile;
- Orange: From 90th percentile to 98 percentile;
- Red: Greater than the 98 percentile value.
Color coding for weather represents:
- Green: No weather factors impact
- Yellow: Minor weather factors impact
- Orange: Moderate weather factors impact
- Red: Severe weather factors impact.
For more information on weather factors, see the Weather Factors Manual.
Clicking on the hyperlink values in the table will open up a new tab with the daily values corresponding to the selected variables. Results can be displayed according to the following options:
- Lines
- 3D Lines
- Columns
- Bars
- 3D Bars
- Areas
- 3D Areas
For information about other available reports in the AERO module, see Display section.

